13. Analytics & Reports
Track your business performance with data-driven insights.
Note: Reports and Advanced Metrics require an active Pro subscription. The compact summary on the home Dashboard is available separately.
13.1 Home Dashboard Summary
The home Dashboard is an operational snapshot. It tells you what needs attention now; it is not a historical report with one date range applied to every card.
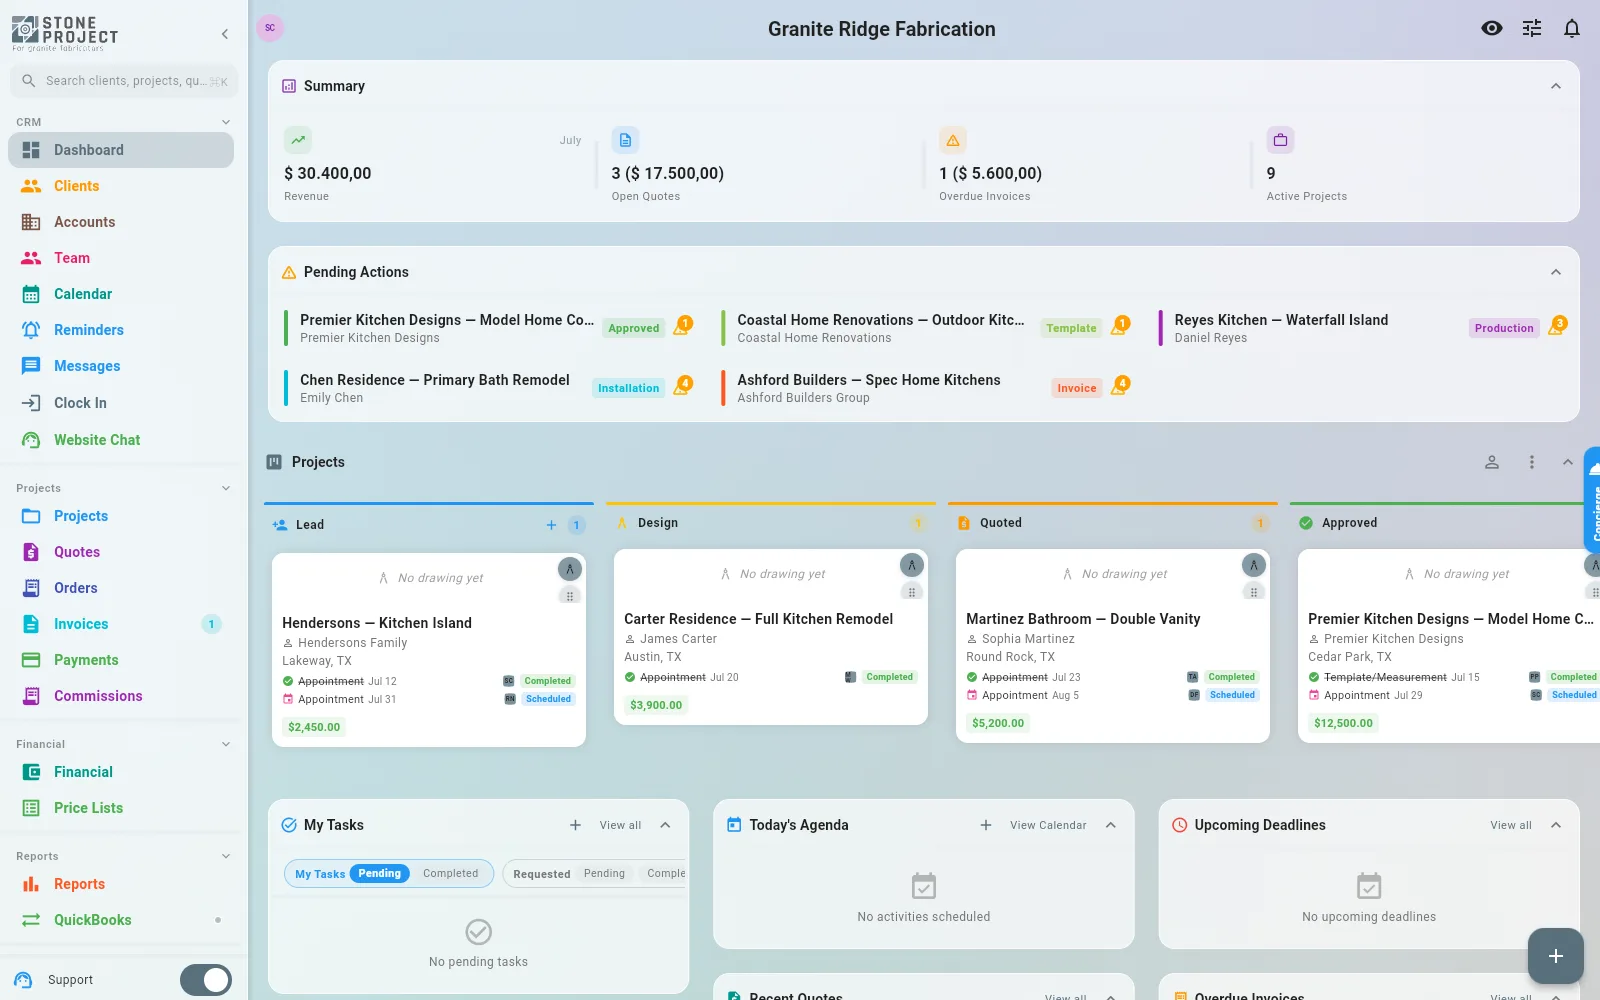
What each card means
| Card | Frame | What it counts |
|---|---|---|
| Revenue | Current calendar month | Completed payments dated inside the month: money collected, not the value of invoices or orders created. |
| Open Quotes | Right now | Quotes that are currently in Sent status. |
| Overdue Invoices | Right now | Invoices that are past their due date and still have an unpaid balance. |
| Active Projects | Right now | Projects whose current stage is neither final nor cancelled. |
The month name appears on Revenue, while the other three cards say Right now. There is no global date selector on this row because a range would change the meaning of the three live-status cards. For example, an invoice can still be overdue today even if it was created months ago.
Analyze a period instead
Open Reports when you need Today, Yesterday, This Week, This Month, This Quarter, This Year, All Time, or a custom start and end date. Reports measures booked sales from orders in the selected period.
From Reports, click the insights icon in the top bar to open Advanced Metrics. Its financial Dashboard compares order revenue with the previous comparable period and also shows gross profit, square footage, average order value, and cost metrics.
Dashboard Revenue and report revenue can differ without either being wrong: the home Dashboard counts completed payments collected this month; Reports and Advanced Metrics count order value booked in their selected period.
13.2 Sales Metrics
Reports has one tab per question. Pick the period at the top (Today, Yesterday, This Week, This Month, This Quarter, This Year, All Time, or a custom range) and every tab follows it:
| Tab | What it shows |
|---|---|
| Overview | Revenue, Orders, Pending activities and Balance Due for the period |
| Sales | Total Jobs, Total revenue, Jobs by stage, Jobs by salesperson, Sales by salesperson, Revenue Over Time |
| Sales Tax | Total, taxable and non-taxable sales, then tax by rate and by customer |
| Customers | Paid invoices by customer (search a customer, or show repeat customers only) |
| Sqft Sales | Total Sqft Sold, Avg Price/Sqft, Total Sold Value, by material and by category (filter by material, Stone Only) |
| Activities | Activities by type and status, and Return visits by installer (below) |
| Inventory | Total pieces, Inventory Value, Slabs vs Remnants, Added vs Sold, by facility and by material |
| Commissions | Commission totals by status and by recipient (see 13.5) |
Use ⋮ → Export PDF or Export Excel to take the report out, or the share button on a card.
How many quotes became a sale (conversion)
In Reports → Sales, the Sales by Salesperson card answers the month-end question: how many quotes each person wrote, how many were approved, and the conversion rate. Pick This Month at the top, and use the share button to take it out as PDF or CSV.
Two things worth knowing before you compare numbers with someone:
- The rows follow the jobs opened in the period. A quote written this month on a job opened last month counts in last month's row, and a revision that replaced an older quote is not counted twice.
- The rate divides approved quotes by jobs opened, so a job that sells two quotes can put one salesperson above 100%.
Sales dashboard and TV mode
Want a screen the sales team can watch all day? In Reports, tap the leaderboard icon in the top bar to open the Sales dashboard (needs the Reports and Analytics permissions). It shows closed deals and revenue, the top seller, average ticket, the biggest deal, a ranking by salesperson, monthly sales, sales by customer type (an account's type; a customer with no account counts as retail) and by lead source, and each person's performance vs goal.
- What counts as a sale: a job moved to Approved in the period, valued by its accepted quote (the job estimate when there is no quote). Turn on Accepted quotes only when you would rather count the sale on the day the customer accepts the quote. The choice is remembered on that device, so the wall TV keeps its basis.
- Goals: tap a salesperson's goal to type their monthly goal; users with permission to edit the company can change it. For a longer period the goal is the monthly figure times the months in the period, and a person without one shows No goal.
- TV mode: tap the TV icon to drop the menus and show the dashboard full screen. It refreshes itself every 5 minutes, so open it once on the shop TV and leave it.
How many invoices you issued in a month
Open Invoices, set Start Date and End Date in the filter, and read the row of figures above the list: Total, Draft, Sent, Partially Paid, Paid, Cancelled, Outstanding and Overdue, all counted for that period. Each figure is also a filter — tap Paid or Outstanding to see exactly those invoices.
13.3 Piece Performance (Piece Analytics)
How your Marketplace listings perform. Open Reports and click the chart icon (Piece Analytics) in the top bar. Pick Week, Month, Quarter, Year or All time.
| Section | What it shows |
|---|---|
| Total Views / Total Favorites | How many times buyers opened and saved your pieces |
| Top Viewed Pieces | Your pieces with the most views |
| Most Favorited Pieces | Your pieces buyers saved the most |
| Views Trend | Views over time |
| Views Heatmap | Views by day and hour, so you know when buyers look |
| Devices / Browsers | Mobile, tablet or desktop, and which browser |
| Pieces by Status | Available, reserved and sold |
| Pieces by Stone Type | Distribution across material types |
| Conversion Funnel | From views to favorites to sold |
A piece with many views and no inquiries usually needs better photos or a price check. The app does not write that suggestion for you; read it off Top Viewed Pieces.
13.4 Financial Reports (Advanced Metrics)
Open Reports and click the insights icon in the top bar (Pro). Pick Last Week, Last Month, Last Quarter, Last Year or All time; figures compare with the previous period of the same length.
| Metric | What it shows |
|---|---|
| Gross Profit / Gross Margin | Order revenue minus cost, in money and percent |
| Average Order Value / Total Orders | Booked orders in the period |
| Collection Rate | Total Collected against Total Invoiced |
| Cost per Sqft / Revenue per Sqft / Profit per Sqft | Per square foot of stone sold |
| Costs Breakdown | Material, Edge, Cutout, Splash and Waterfall cost |
| Top Performers / Bottom Performers | The jobs with the best and worst margin |
| By Project Type | Margin by type of job |
13.5 Commission Reports
Track commission payables and payouts for your sales team:
- Go to More > Reports and open the Commissions tab. The period picker at the top applies.
- The cards show Total (commission amount), Paid, Pending and the number of commissions.
- Status Breakdown splits them into Pending, Approved, Paid, Partial and Cancelled.
- By Recipient lists each person who earns commission, a team member or a client (referral), with how many commissions, the total and a bar of how much is already paid.
The Reports tab is a summary with no drill-down. The day-to-day place is Commissions in the side menu (next to Payments; Pro, needs invoice access). It lists every commission with the totals on top (Total, Paid, Pending, Total Cancelled), and filters by status, a search, a date range and a minimum/maximum amount. Tap a commission to see it, then Approve, Mark as Paid (payment method and reference) or Cancel Commission; a cancelled one can be deleted. Create Commission adds one by hand (team member or client, optional project and quote).
Commission rates are set per client or per project — see Billing > Commission Reports for setup details.
Return visits (repairs) by installer
How many times did a crew have to go back to a job? Go to More > Reports > Activities and scroll to Return visits:
- Return visits: repair activities scheduled in the selected period (cancelled ones don't count).
- Installs: install activities scheduled in the same period.
- By installer: each repair is counted for the crew of the job's last install before the repair (the install's assignee and participants, so a two-person crew both get it). Under each name, "Installed N jobs in this period" gives the scale, so a busy installer isn't read as a careless one.
- No install on record: repairs on jobs that have no install activity in the app (for example jobs installed before you started using Stone Project, or a repair-only job).
Tap a name to see each repair with its date, job and notes, and tap a repair to open it. Repairs come from the Repair activity type, which is also what the "schedule the return visit" switch creates when you complete an activity with a problem.
13.6 Time Clock Reports
Time clock hours are not a tab in Reports. They live on the Team screen:
- Time Records (clipboard icon in the Team top bar): Total Hours, Entries and Avg/Day for This Week, Last Week, This Month, Last Month or a custom range, filtered by employee. Expand an entry for check-in and check-out, break time, worked time, the photos and the map. Add time entry fixes a missed punch.
- Report Delivery (the clock-with-arrow icon in the Team top bar): emails a Daily, Weekly or Monthly time report to the addresses you choose, at the time you set. Add Report creates one.
- Pending reviews: a badge on the Time Clock screen opens the review requests (see Calendar > Time Clock).
For payroll software, Settings → Payroll export (Pro) downloads the same hours as a CSV.
13.7 Crew Pay (what to pay templaters, fabricators and installers)
Pay your crew by the job instead of by the hour? Go to More > Reports and open the Crew pay tab. It shows up only for people who can see costs. The period picker at the top applies: pick the week you are paying.
- The Crew pay card is the total for the period, with how many people earned something.
- Each person is a row with their total. Tap it to see every line: the activity (Template, Fabrication, Installation), the job, the date, and how it was worked out (for example
42.50 sq ft × $8.00, or$150.00 per job). - Download PDF gives that person a statement for the period, ready to hand over or keep with the payment.
Where the numbers come from
- A line is a Template, Fabrication or Install activity that was completed in the period and assigned to that person. Participants who were only added to the activity are not paid; assign it to whoever gets the money.
- The square feet are the job's drawings (or the phase the activity belongs to).
- Without a rate of their own, the person is paid at the labor cost you already typed in your price list: fabrication and install use the cost per sq ft of the default line, template uses the cost of the Other item with "template" in its name. Those lines say price list.
- Sales commission is a percentage of the subtotal of the quotes accepted in the period where that person is the salesperson. Revised quotes that were replaced don't count twice.
Nothing is saved or posted to your books: the statement is worked out each time you open it.
Setting each person's rates
Open the person and tap Pay rates (needs permission to edit the company):
- For Template, Fabrication and Installation, type what you pay per sq ft or per job. Leave a box empty to keep using the price-list cost.
- Paid per item pays extra items from the job's quote: full backsplash, mitered edges and waterfalls, each edge profile, cutouts, removal, plywood, sealing, trip charge and the other items in your price list. Tap Add item, choose it, type the rate (per sq ft, per lin ft, each, or per job) and pick Paid on: the activity that earns it (Template, Fabrication or Installation). The quantity comes from the job's accepted quote, and the item is paid once per job, to whoever completes that activity first.
- Sales commission: type the Commission %.
- Tap Save. The tab recalculates right away.
Commissions you approve and mark as paid one by one live in Commissions (see 13.5); Crew pay is the weekly statement per person and doesn't create or change those records.